World Class Provider Of Foreign Exchange Trading Services
Two day bullish patterns
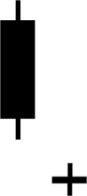
Bullish Doji
Reliability Rating: moderate
A bullish Doji starts with a large black candle and then a down gapping Doji. Since on the second day is trades within a small range, it shows many positions have changed and potential for a reversal.
Waiting for the next day to open into a white candle would be prudent to confirm the trend however when the bullish Doji occurs it is worthwhile having a look.
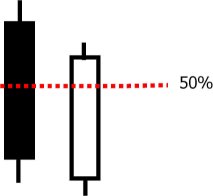
Kirikomi or Kirihaeshi or Piercing Line candlestick pattern
Reliability Rating: Low/moderate
This two day candlestick opens with a black marubozu candlestick and is followed by a kirikomi candlestick ( a kirikomi candlestick is a marubozu candlestick which has opened lower than the previous low and closes above the 50% level, but below the black marubozu's opening price.)
The first candle shows a down. On the second day, the candle opens lower than the previous day's low. This creates an "overnight price gap". Typically the pattern does not weaken further (if it does it's marginal), the market then fills the gap.
By closing above the 50% level, the kirikomi candlestick is considered a stong bullish signal.
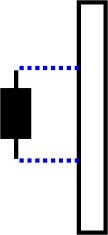
Bullish Belt Hold
Reliability Rating: Low
The bullish belt hold pattern is when a white candle occurs in a downtrend with no lower shadow and opens at a new low. This pattern shows a rally from the buyers towards the end of the trading session and gives some indication of a potential trend reversal.
Bullish Meeting Lines
Reliability Rating: Moderate
The first candle in this pattern is a black candle, the second day a white candle gaps open with a lower body closes at the same price as the previous black candle. This signifies that the price has hit resistance and a short uptrend should ensue.
Bullish Kicking Pattern
Reliability Rating: High
This pattern consists of a black marabuzo followed by a gapped up white marabuzo.
This pattern is a strong sign that an uptrend will ensue. The major trend is not as important with this pattern as with other patterns and is considered a highly reliable signal
Bullish Engulfing Pattern (Bullish Tsutsumi)
Reliability Rating: Moderate
This pattern composes of "a second day long white candlestick that opens lower and closes higher than the preceding small black body."
The name comes from the idea that the white candle "engulfs" the black candle. This can also be know as a "bullish key reversal" and is a signal to reverse and go bullish.
It is common to see a neutral period follow this pattern since it takes time for the market to react to the large one day movement.
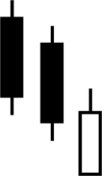
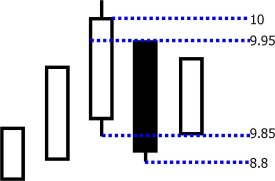
Bullish Tasuki Candlestick
Reliability Rating: Low
The bullish tasuki candlestick comprises of "a long black candlestick that opens within the range of the previous day's long white body, and closes marginally below the previous day's low". (Candlesticks do not have to have long bodies if the two days ranges are about the same size). The second day of the formation, the candle opens lower than the previous close. (This black candle occurs in an otherwise uptrending market). This move can be interpreted as profit taking. At this point, the profit taking during an uptrend where the bullish tasuki occurs
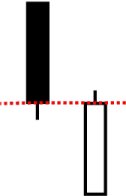
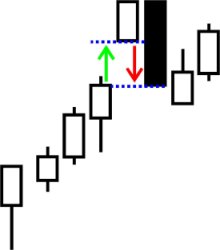
Upside Gap Tasuki Candlestick
Reliability Rating: Moderate
The upside gap tasuki is "a second day black candle that closes an overnight gap opened on the preious day by a white candle."
The pattern is similar to a common gap. It provides a short term opportunity to sell to fill the gap. The filling of the upside gap is an indication that the uptrend will resume.
No warranties are given by Traders Exchange Corp. and no warranties are implied regarding the content of the suggested reading material or the content of the website(s) which can be accessed through this website. Traders Exchange Corp. shall not be liable in any way for losses or liability of any kind to any person resulting directly or indirectly through the use in any way by such person of the information referred to and/or use of the suggested reading material or the website(s), however such loss or liability occurs, and whether financial or otherwise. The pages and the opinions or information contained in the suggested reading material or these website(s) are the creation of outside parties and do not necessarily reflect the opinions or representations of Traders Exchange Corp.