World Class Provider Of Foreign Exchange Trading Services
Bearish Candlestick Patterns
Two day bearish patterns
Bearish Doji
Reliability Rating: moderate
A bearish Doji starts with a large white candle and then an up gapping Doji. Since on the second day is trades within a small range, it shows many positions have changed and potential for a reversal.
Waiting for the next day to open into a black candle would be prudent to confirm the trend however when the bearish Doji occurs it is worthwhile having a look.
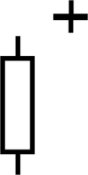
Bearish Belt Hold
Reliability Rating: Low
The bearish belt hold pattern is when a black candle occurs in an uptrend with no upper shadow and opens at a new high. This pattern shows a rally from the sellers towards the end of the trading session and gives some indication of a potential trend reversal.
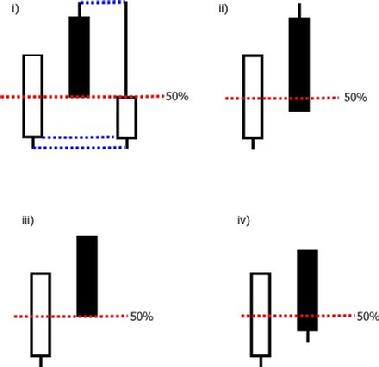
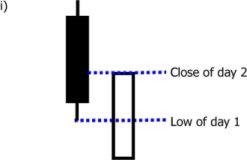
Dark Cloud Cover (Kabuse Candlestick)
Reliability Rating: Moderate
The dark cloud cover (Kabuse candlestick) has an white candle followed on the second day by a black candlestick that opens at a higher price. The black candlestick should open approximately half way up the white candle's body. It is the black candle which negates the previous day's movement that gives the pattern it's name, a dark cloud cover (or kabuse candlestick). This pattern is considered a bearish reversal (sell).
Atekubi (Ate) Candlestick
Reliability Rating: Low
The atkubi candlestick's second day small white candle which has opened lowed than the previous day's low and then closes at a high. Typically the volume is lower and the current close at the high is only equal to the previous day's low. This signal is seen most often in a down trend and the appearance of this signal indicates the down trend will continue.
Irikubi Candlestick
Reliability Rating: Low
The irikubi candlestick is a modified atekubi candlestick, the difference is that the white candlestick's high can be marginally higher than the black candlestick low. This pattern is bearish an indicates futher selling ahead.
Sashikomi Candlestick
Reliability Rating: Low
The sashikomi candlestick is a alteration of the irikubi candlestick. This is where the white candle opens lower than the black candle's low, and closes at the daily high. This is considered a bearish signal.
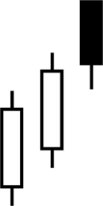
Bearish Engulfing Pattern (Bearish Tsutsumi)
Reliability Rating: Moderate
This pattern is pretty much the opposite of the bullish engulfing pattern. The first day white candle is engulfed by the second day black candle. Volume tends to be high during this signal and indicates a change in sentiment.
Bearish Kicking Pattern
Reliability Rating: High
This pattern consists of a white marabuzo followed by a gapped down black marabuzo.
This pattern is a strong sign that a downtrend will ensue. The major trend is not as important with this pattern as with other patterns and is considered a highly reliable signal
Bearish Tasuki Candlestick
Reliability Rating: Low
The tasuki pattern has a second day white candle that has opened within the body of the first day black candle's body. The white candle then closes slightly above the black candle's low. Either candle can have varying body sizes as long as the range of both candles are of similar size. This pattern is found in down trends and is viewed as a period of profit taking. This is a bearish signal.
Downside Gap Tasuki Candlestick
Reliability Rating: --
This pattern has a second day white candle that closes an overnight gap from a black candle. This provides a very short term opportunity to buy to fill the gap, however, it has no other significance. It is typical for the down trend to continue after this pattern occurs.
No warranties are given by Traders Exchange Corp. and no warranties are implied regarding the content of the suggested reading material or the content of the website(s) which can be accessed through this website. Traders Exchange Corp. shall not be liable in any way for losses or liability of any kind to any person resulting directly or indirectly through the use in any way by such person of the information referred to and/or use of the suggested reading material or the website(s), however such loss or liability occurs, and whether financial or otherwise. The pages and the opinions or information contained in the suggested reading material or these website(s) are the creation of outside parties and do not necessarily reflect the opinions or representations of Traders Exchange Corp.