World Class Provider Of Foreign Exchange Trading Services
Reversal Patterns
(Tops And Bottoms)
Reversal patterns, or tops and bottoms, signify a fundamental change in the long term trend.
Overview
Tops are usually less stable and shorter than bottoms.
Bottoms usually have smaller price variations and are slower to establish.
Volume is usually more important on the upside.
Confirmation of a top or bottom is in a double top or bottom (or a short channel.)
The most popular Reversal Patterns include: head and shoulders, double tops and bottoms, triple tops and bottoms, and V-formations.
Interpretation & Signals
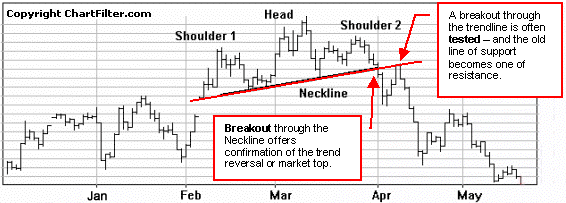
Head & Shoulders
The well known head and shoulders pattern is formed by three peaks; the center peak, or head, is slightly higher than two lower, and not necessarily symmetrical, shoulders. The line joining the bottoms of the two shoulders is called the neckline. Due to fluctuations, the neckline is rarely symmetrical or perfectly horizontal.
The pattern isn't complete until the neckline is broken. It is often good to wait for confirmation - for example, two successive closes below the neckline. Remember, markets often bounce back to the Neckline after the breakout and this becomes a new level of resistance.
Volume should be assessed to confirm the validity of these patterns. Volume is normally heaviest during the formation of the left shoulder and also tends to be quite heavy as prices approach the peak. The real confirmation of a developing Head and Shoulders pattern comes with the formation of the right shoulder, which is invariably accompanied by distinctly lower volume.
Some traders use the distance between the neckline and the top of the head to project a "price objective." The price objective is determined by measuring from is the top of the head to the neckline, and using this distance from the breakout point downwards.
An InvertedHead and Shoulderspattern is a mirror image of the Head & Shoulders pattern (forming a market bottom).
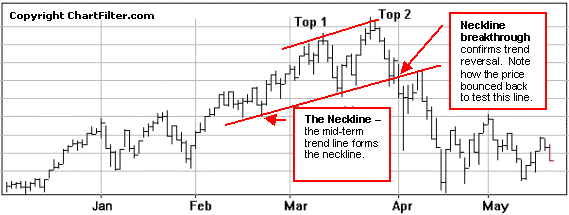
Double Tops
Double Tops are another reliable and frequently used reversal pattern. This pattern consists of two tops of approximately equal height. A line is drawn below and parallel to the resistance line that connects the two tops. The neckline is a strong support for price level but eventually fails.
As with a Head and Shoulders, after the two rallies and their respective reversals are completed the double tops is confirmed only when the neckline is broken. The support line then becomes a resistance line, which often holds a market rebound.
A Double Bottom pattern is a mirror image of a double top pattern: The average height of the bottoms gives a good indication of the price objective.
Triple Top
A tnple topis a cross between a head and shoulders and double top. This formation consists of three tops of approximately equal height. A line is drawn below and parallel to the resistance line that connects the three tops. The neckline is a strong support for price level but eventually fails. The support line then becomes a resistance line, which usually holds any market rebound.
Triple Bottom
A triple bottompatternisa cross between an inverted head and shoulders and double bottom pattern.
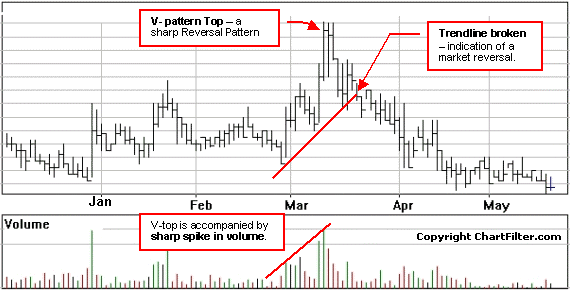
V- Pattern
The V pattern is an unusual pattern in that a sharp trend switches from one direction to the other without warning and with high volume at or just after the turn around.
Further points
Trend reversals offer some of the most important opportunities for entering a market with a good profit potential. They usually represent fundamental changes in the underlying character of a particular market and often go on to yield big moves.
However, a market top or bottom is often difficult to identify. It is even more difficult to choose appropriate entry and exit points. One problem is distinguishing between an actual change in trend or merely a congestive phase in the middle of a move. It is usually advisable to wait for prices to actually confirm a trend reversal by developing one of these well-tested and reliable reversal patterns. The actual buy or sell signals are based on a breakout in the direction of the new trend.
Here are some general observations about Reversal patterns:
A breakout through a trend line is used in conjunction with a price pattern to yield signals in terms of both price level and timing.
The longer the time required to form a pattern and the greater the price fluctuations within it, the more substantial the coming price movement is likely to be. The time frame is normally from several days to several months - intraday patterns are not considered reliable.
No warranties are given by Traders Exchange Corp. and no warranties are implied regarding the content of the suggested reading material or the content of the website(s) which can be accessed through this website. Traders Exchange Corp. shall not be liable in any way for losses or liability of any kind to any person resulting directly or indirectly through the use in any way by such person of the information referred to and/or use of the suggested reading material or the website(s), however such loss or liability occurs, and whether financial or otherwise. The pages and the opinions or information contained in the suggested reading material or these website(s) are the creation of outside parties and do not necessarily reflect the opinions or representations of Traders Exchange Corp.